URL Classification
Preliminary Visualizations
Approach
- From the intelligence gathered in Slides 69 - 76, it was observed that adding in additional characteristics, such as the number of symbols and number of digits, can help with classifying malicious URLs.
- To further visualize this analysis, a scatterplot was created with the following characteristics:
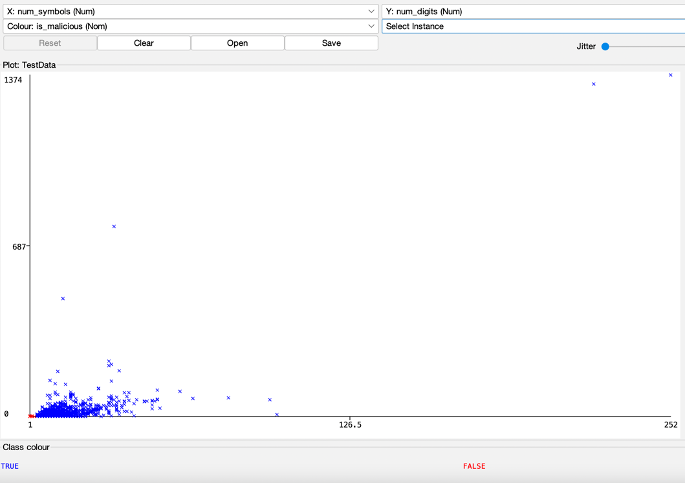
- X Axis = Number of Symbols
- Y Axis = Number of Digits
- Red Dot (x) = Not Malicious
- Blue Dot (x) = Is Malicious
Initial Observations
- From the initial visualization, it can be observed that malicious URLs are associated with larger amounts of numbers and/or symbols (within this dataset).
- All non-malicious URLs can be seen near the bottom-left corner, indicating a minimal presence of numbers and symbols in their URLs.
- Graphing this dataset helped visualize some potential discrepancies/dissimilarities in the dataset that will be further discussed in Milestone 4.